
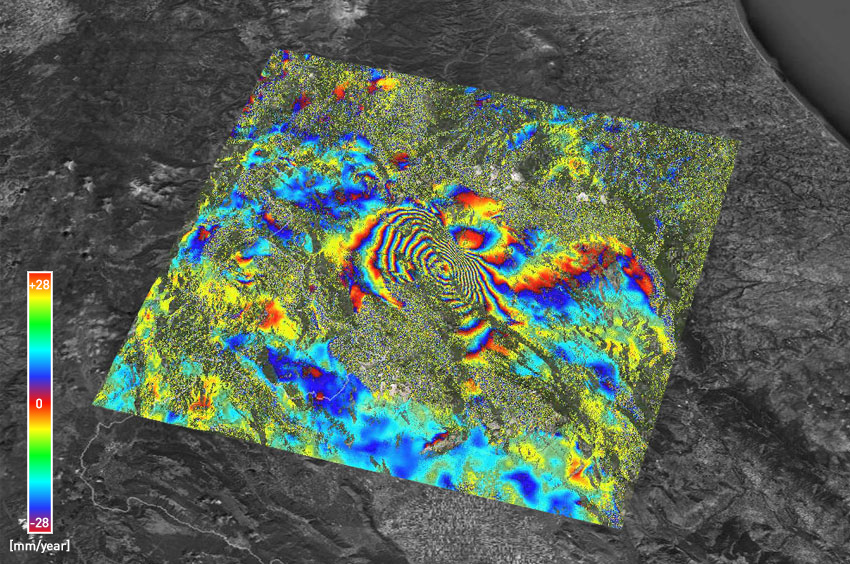
Earthquake and Fault Map (L’Aquila, Italy): Image shows an interferogram of the deformation pattern associated with an earthquake. In a similar manner, movement along seismic fault lines can also be detected. The colours indicate phase change in the received radar signal, which can be equated and mapped to ground movement as the wavelength of the radar signal is known [Img src TRE-Altamira]
Earthquake and Fault Map (L’Aquila, Italy): Image shows an interferogram of the deformation pattern associated with an earthquake. In a similar manner, movement along seismic fault lines can also be detected. The colours indicate phase change in the received radar signal, which can be equated and mapped to ground movement as the wavelength of the radar signal is known [Img src TRE-Altamira]
