
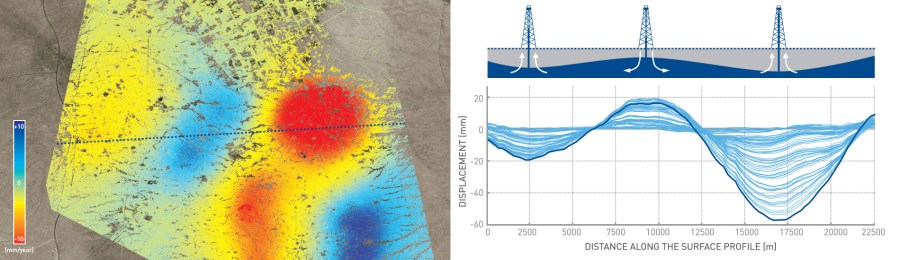
Monitoring Enhanced Oil Recovery Operations: Ground deformation maps (left) show the surface response to fluid injection (e.g. waterflooding / SAGD / CSS operations) and extraction activities, which provide an additional information layer to determine pressure changes in the reservoir. Red measurement points indicate movement away from the satellite (typically subsidence), green indicates stability and blue is towards the satellite (typically uplift). Cross-section tools (right) highlight areas of rapid displacement rates – evidence of reservoir compartmentalisation [Img src TRE-Altamira]
Monitoring Enhanced Oil Recovery Operations: Ground deformation maps (left) show the surface response to fluid injection (e.g. waterflooding / SAGD / CSS operations) and extraction activities, which provide an additional information layer to determine pressure changes in the reservoir. Red measurement points indicate movement away from the satellite (typically subsidence), green indicates stability and blue is towards the satellite (typically uplift). Cross-section tools (right) highlight areas of rapid displacement rates – evidence of reservoir compartmentalisation [Img src TRE-Altamira]
